

Introduction
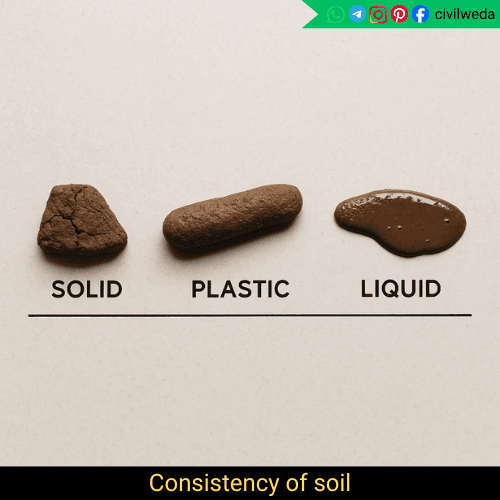
Soil is one of the most important materials used in civil engineering. Its behaviour changes greatly with the amount of water it contains. When water is added to a fine-grained soil like clay, its consistency changes from a hard solid to a soft plastic, and finally to a flowing liquid.
To describe these changes scientifically. As per Wikipedia, Swedish scientist Albert Atterberg (1911) introduced a set of limits known as the Atterberg Limits.
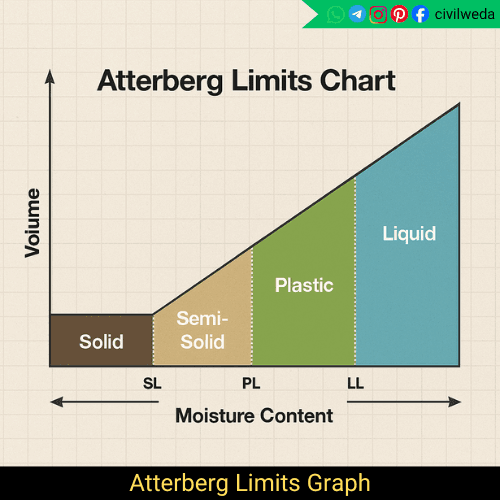
These limits define the boundaries between different states of soil consistency: solid, semi-solid, plastic, and liquid. These different stages of consistency are shown in the figure.
By determining these limits, engineers can understand how a particular soil will behave under varying moisture conditions.
In simple words, Atterberg Limits help us understand how much water a soil can hold before it starts to flow or crack. This knowledge is extremely useful in designing foundations, embankments, roads, and other earth structures, ensuring safety and stability in construction.
In this article, you will learn about the definition, types, formulas, and importance of Atterberg Limits in Soil Mechanics. So, let’s get started without any further delay..
What are Atterberg Limits?
The Atterberg Limits are a set of water content boundaries that define the different states of consistency of fine-grained soils, especially clays and silts. As the water content in soil changes, its physical behaviour also changes from solid to semi-solid, plastic, and finally to a liquid state.
These limits help engineers to describe and measure the consistency and plasticity of soil in a scientific way. They are essential in soil classification and are used in almost every geotechnical investigation.
In other words, the Atterberg Limits represent the moisture content ranges at which soil changes its state.
When the soil contains very little water, it behaves like a solid. As water increases, it becomes semi-solid and then plastic. Beyond a certain water content, it becomes liquid and starts to flow easily.
The three principal limits that define these transitions are:
- Liquid Limit (LL) – Boundary between the plastic and liquid state.
- Plastic Limit (PL) – Boundary between the semi-solid and plastic state.
- Shrinkage Limit (SL) – Boundary between the solid and semi-solid state.
These limits are collectively known as the Atterberg Limits and are used to determine the plasticity characteristics of soil, which play a vital role in designing safe and durable civil engineering structures.
I hope you clearly understand the Atterberg Limits. Now we are going to our next section on types of Atterberg Limits.
Types of Atterberg Limits
The Atterberg Limits are divided into three main categories: Liquid Limit (LL), Plastic Limit (PL), and Shrinkage Limit (SL). Each of these limits marks a specific change in the soil’s state as its water content varies.
Let’s understand them one by one, in detail.
1. Liquid Limit (LL)
The Liquid Limit is the minimum water content at which the soil starts to behave like a liquid and begins to flow under its own weight. At this stage, the soil loses its shear strength and can no longer retain its shape.
It represents the boundary between the plastic and liquid states of soil.
Test Method:
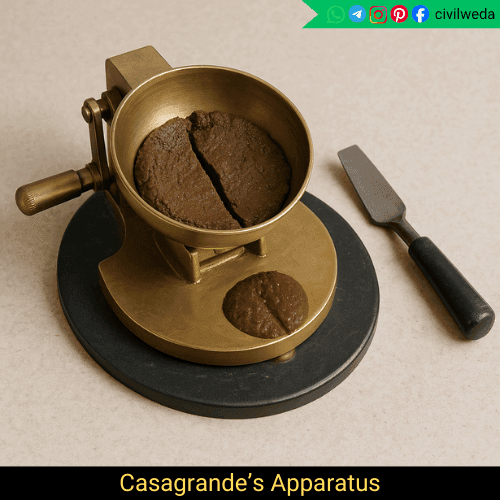
The most common method to determine the Liquid Limit is the Casagrande’s apparatus test. In this test, a soil paste is placed in a brass cup, and a groove is made through the centre. The cup is repeatedly dropped from a height of 10 mm until the groove closes for a length of about 12 mm. The water content corresponding to 25 blows is taken as the Liquid Limit (LL). A typical Casagrande’s apparatus is shown in the figure:
Alternatively, it can also be determined by the Cone Penetrating meter method.
Formula of Liquid Limit:
Where:
- w = Liquid Limit (water content at 25 blows)
- w₁ = Water content at N₁ blows
- w₂ = Water content at N₂ blows
- N₁, N₂ = Number of blows corresponding to w₁ and w₂
Significance of Liquid Limit:
Indicates the water holding capacity of the soil. Helps to identify compressible or expansive soils. A Higher Liquid Limit means the soil contains more clay and is less stable under load.
2. Plastic Limit (PL)
The Plastic Limit is the minimum water content at which the soil can be rolled into threads of 3 mm diameter without breaking.
It marks the boundary between the semi-solid and plastic states of soil.
At this stage, the soil is mouldable and can be easily shaped without cracking; this is known as the plastic state of soil.
Test Method of Plastic Limit (PL) :
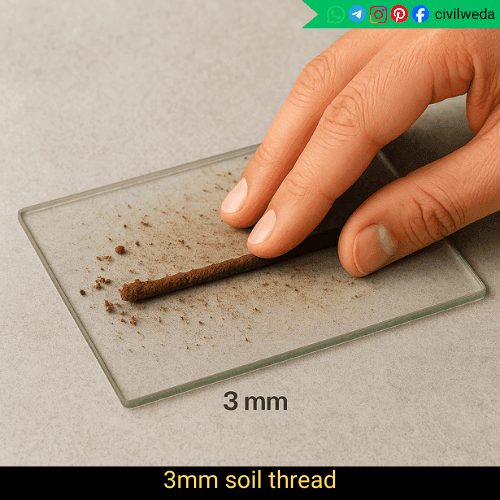
A small portion of soil is rolled on a glass plate or flat surface into a thread. When the thread just starts to crumble at a diameter of 3 mm, the corresponding water content is noted as the Plastic Limit (PL). As shown in the figure.
Formula Plastic Limit (PL) :
Where,
- W1=Weight of dry soil
Significance of Plastic Limit (PL)
- Determines the workability of soil.
- Used in the calculation of Plasticity Index (PI = LL – PL).
- Soils with low PL are less cohesive and more brittle.
3. Shrinkage Limit (SL)
The Shrinkage Limit is the maximum water content at which further loss of moisture does not cause any decrease in the volume of soil. It defines the boundary between the solid and semi-solid states.
At water contents below the Shrinkage Limit, the soil is in a solid state, and any further drying does not reduce its volume.
Test Method of Shrinkage Limit
A soil sample of known volume and weight is dried in an oven. The decrease in volume and weight due to drying is used to determine the Shrinkage Limit (SL).
Formula of Shrinkage Limit
where:
W₁ = Weight of wet soil (before drying)
W₂ = Weight of dry soil (after drying)
V₁ = Volume of wet soil
V₂ = Volume of dry soil
ρw = Density of water (1 g/cm³)
Significance of Shrinkage Limit
Indicates the shrinkage and swelling behaviour of soil. Important in identifying expansive clays, which cause cracks in pavements and buildings. Useful in predicting the volume change of soil due to moisture variation.
Derived Indices of Atterberg Limits
The Atterberg Limits (Liquid Limit, Plastic Limit, and Shrinkage Limit) tell us about the condition of soil at different water contents.
But in real engineering practice, we often need to know how plastic, soft, or stiff a soil is in its natural state.
For that, some derived indices are used, which are simple formulas that help engineers describe the plasticity and consistency of soil more precisely.
There are mainly three important derived indices:
- Plasticity Index (PI)
- Liquidity Index (LI)
- Consistency Index (CI)
1. Plasticity Index (PI)
The Plasticity Index (PI) tells us how much range of water content the soil can stay plastic, that means, it can be moulded or shaped without cracking or flowing
Mathematically,
PI = LL- PL
Where:
- LL = Liquid Limit
- PL = Plastic Limit
- PI = Plasticity Index
Note Points:
- If the PI value is large, it means the soil contains more clay and is highly plastic.
- If the PI value is small, it means the soil contains more silt and is less plastic.
- If the PI value is zero, the soil is non-plastic, like sand.
2. Liquidity Index (LI)
The Liquidity Index (LI) shows the natural condition of soil, how soft or stiff the soil is in the field, depending on its natural water content.
It tells us where the natural moisture of soil lies between its Plastic Limit and Liquid Limit.
Where:
- W = Natural water content of the soil
- PL = Plastic Limit
- PI = Plasticity Index
3. Consistency Index (CI)
The Consistency Index (CI) is just the opposite of the Liquidity Index (LI).
It tells us how firm or stiff the soil is in its natural condition.
Where:
- LL = Liquid Limit
- W = Natural Water Content
- PI = Plasticity Index
- CI = Consistency Index
Note Points:
- If CI = 1, the Soil is at its Plastic Limit (stiff condition)
- If CI = 0, the Soil is at its Liquid Limit (soft condition)
- If CI > 1, the Soil is harder than the Plastic Limit
- If CI < 0, the Soil is in a liquid state (too soft)
In Simple Words:
- PI tells us how plastic the soil is.
- LI tells us how soft or wet the soil is in its natural state.
- CI tells us how stiff or firm the soil is naturally.
These indices are extremely useful in soil classification, understanding field conditions, and deciding whether the soil is suitable for construction or not.
Importance of Atterberg Limits
The Atterberg Limits are not just laboratory test values; they are the foundation of soil classification and analysis in geotechnical engineering. These limits help engineers understand how soil will behave under different moisture conditions, and how safe it is to use for construction works.
Let’s see the major reasons why Atterberg Limits are so important 👇
1. Soil Classification
Atterberg Limits are used to classify fine-grained soils (such as clays and silts) based on their plasticity.
Using the Plasticity Index (PI) and Liquid Limit (LL) values, soils can be grouped under different categories in the Unified Soil Classification System (USCS) and Indian Standard (IS) systems.
For example:
- Low LL and low PI → Silt
- High LL and high PI → Clay
This classification helps engineers select suitable soils for foundations, embankments, and roads.
2. Determining Soil Workability
Atterberg Limits indicate how easily a soil can be moulded or compacted at a particular moisture content.
- A soil with low plasticity (low PI) is easier to handle and compact.
- A soil with high plasticity is sticky, difficult to work with, and may require stabilisation.
Hence, these limits help in deciding the best moisture content for field operations like compaction and construction.
3. Understanding Strength and Compressibility
The water content of soil directly affects its shear strength and compressibility.
- Soils with high Liquid Limits tend to have low strength and high compressibility.
- Soils with low Liquid Limits are stronger and less compressible.
Therefore, knowing the Atterberg Limits helps engineers estimate soil stability and settlement behaviour before construction.
4. Identifying Expansive Soils
Some clay soils expand when they absorb water and shrink when they dry.
Such expansive soils can cause cracks in buildings, pavements, and retaining walls.
By observing very high LL and PI values, engineers can easily identify problematic clays like black cotton soil and take preventive measures such as soil stabilisation or replacement.
5. Foundation and Embankment Design
In designing foundations, dams, and embankments, knowing how the soil behaves with changing moisture is crucial.
- If the soil near the foundation is highly plastic, it may undergo swelling or shrinkage, leading to cracks or failure.
- Soils with moderate plasticity are usually considered safe and stable for supporting loads.
Thus, Atterberg Limits help in selecting the right soil type and determining the safe bearing capacity of the ground.
6. Quality Control in Construction
During road or embankment construction, the Atterberg Limits are often checked to ensure that the soil used meets specification standards. It is a quick and reliable indicator of soil quality and behaviour under field conditions.
Read more Civil Engg Topics
- Viscosity
- Types of soil
- Basic Properties of Soil
- Bulking of sand
- Bitumen concrete
- Pile Foundation
- Surface tension
- Vapour Pressure
- Ready Mixed Concrete
- Capillary action
- Timber
- Chlorination of water
Conclusion
The Atterberg Limits are one of the most important tests in soil mechanics. They help engineers to understand how a fine-grained soil behaves when its water content changes.
By knowing the Liquid Limit (LL), Plastic Limit (PL), and Shrinkage Limit (SL), we can easily determine whether a soil is plastic, cohesive, or expansive.
These limits not only help in classifying soils but also in predicting their engineering behaviour, such as strength, compressibility, and volume change. Soils with high Atterberg Limits (like clay) are generally weak and highly compressible, while soils with low Atterberg Limits (like silt or sand) are stronger and more stable.
In short, Atterberg Limits act as a mirror to the soil’s behaviour; they show how soil reacts to water, how stable it is, and whether it can safely support structures.
Thus, understanding and determining the Atterberg Limits is an essential part of every geotechnical investigation and forms the basis of safe and economical civil engineering design.
FAQs
1. Why are Atterberg Limits important in civil engineering?
Atterberg Limits are extremely important because they help engineers classify soils, predict their strength and compressibility, and identify expansive clays.
2. What happens if Plastic Limit (PL) is greater than Liquid Limit (LL)?
If PL > LL, the result is physically impossible. It usually means there was an error during testing or the soil is non-plastic (like sand). In such cases, the Plasticity Index (PI) is taken as zero, and the soil is described as non-plastic.
3. What is the Atterberg Principle?
The Atterberg Principle is based on the idea that fine-grained soils (especially clayey soils) change their consistency and behaviour depending on the amount of water (moisture content) they contain.
I hope you clearly understand the Atterberg Limits. If you have any questions regarding these limits, you can ask through the comment box.
Thank You for Reading! 🙏
We hope this article helped you clearly understand the Atterberg Limits in civil engineering. If you found this complete article useful, please share it with your friends and university students. For more informative posts on civil engineering topics, stay connected with
Civil Weda. 🚀